×
Energy
Oil
Nuclear
Renewables
Bioenergy
Coal
Environment
Emissions
Sustainability
Carbon Markets
Technology
Energy Storage and Batteries
Carbon Capture
Transportation
Infrastructure
Materials
Space
Electricity
Hydrogen
Mining and Minerals
Energy
Oil
Natural Gas
Nuclear
Renewables
Bioenergy
Coal
Environment
Emissions
Sustainability
Carbon Markets
Technology
Energy Storage and Batteries
Carbon Capture
Transportation
Infrastructure
Materials
Space
Electricity
Hydrogen
Mining and Minerals
Search
Susbcribe
Susbcribe
Home »
Infographics - Page 5
Infographics
Energy
Bioenergy
Coal
Nuclear
Oil
Natural Gas
Renewables
Environment
Carbon Markets
Emissions
Sustainability
Technology
Carbon Capture
Electricity
Energy Storage and Batteries
Hydrogen
Infrastructure
Materials
Mining and Minerals
Space
Transportation
Category Menu
Energy
Bioenergy
Coal
Nuclear
Oil
Natural Gas
Renewables
Environment
Carbon Markets
Emissions
Sustainability
Technology
Carbon Capture
Electricity
Energy Storage and Batteries
Hydrogen
Infrastructure
Materials
Mining and Minerals
Space
Transportation
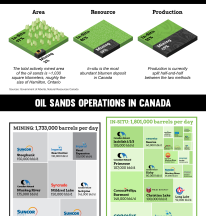
Visualizing the Size and Scale of the Canadian Oil Sands
Aaron Foyer
June 18, 2021
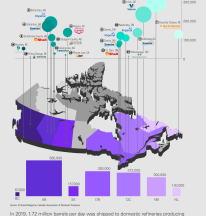
Mapping out Canadian Refineries from Coast to Coast
Aaron Foyer
May 28, 2021
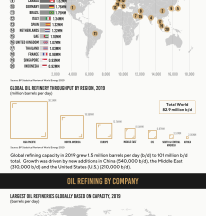
The Global Crude Oil Refining Industry
Aaron Foyer
May 21, 2021
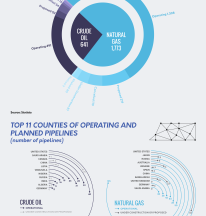
Visualizing Future Pipeline Projects Around the World
Aaron Foyer
May 7, 2021
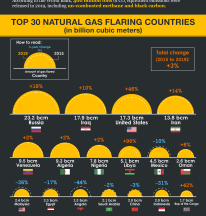
Ranking the Top 30 Global Natural Gas Flaring Countries
Aaron Foyer
April 30, 2021
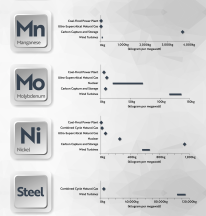
The Energy Transition: Mineral Demand for a Low-Carbon Future
Aaron Foyer
April 23, 2021
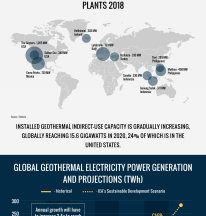
Geothermal for Power Generation
Aaron Foyer
April 9, 2021
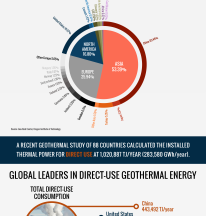
Geothermal for Heating
Aaron Foyer
April 2, 2021
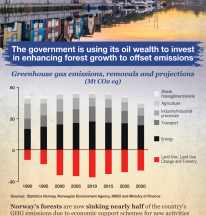
How Norway is Using its Oil Industry to Go Green
Aaron Foyer
March 19, 2021
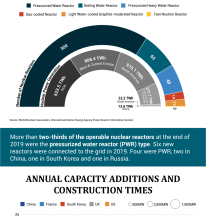
Visualizing Global Atomic Power
Aaron Foyer
February 26, 2021
Posts navigation
Previous
1
…
4
5
6
Next
Search for: