×
Energy
Oil
Nuclear
Renewables
Bioenergy
Coal
Environment
Emissions
Sustainability
Carbon Markets
Technology
Energy Storage and Batteries
Carbon Capture
Transportation
Infrastructure
Materials
Space
Electricity
Hydrogen
Mining and Minerals
Energy
Oil
Natural Gas
Nuclear
Renewables
Bioenergy
Coal
Environment
Emissions
Sustainability
Carbon Markets
Technology
Energy Storage and Batteries
Carbon Capture
Transportation
Infrastructure
Materials
Space
Electricity
Hydrogen
Mining and Minerals
Search
Susbcribe
Susbcribe
Home »
Infographics - Page 2
Infographics
Energy
Bioenergy
Coal
Nuclear
Oil
Natural Gas
Renewables
Environment
Carbon Markets
Emissions
Sustainability
Technology
Carbon Capture
Electricity
Energy Storage and Batteries
Hydrogen
Infrastructure
Materials
Mining and Minerals
Space
Transportation
Category Menu
Energy
Bioenergy
Coal
Nuclear
Oil
Natural Gas
Renewables
Environment
Carbon Markets
Emissions
Sustainability
Technology
Carbon Capture
Electricity
Energy Storage and Batteries
Hydrogen
Infrastructure
Materials
Mining and Minerals
Space
Transportation
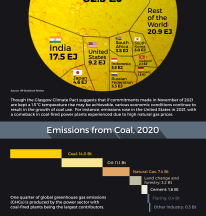
Coal 2021: How Black Carbon Still Runs the World
Aaron Foyer
January 21, 2022
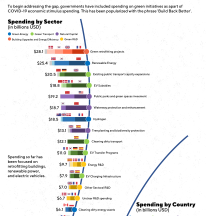
The Emissions Gap and What Countries Are Doing About It
Aaron Foyer
December 3, 2021
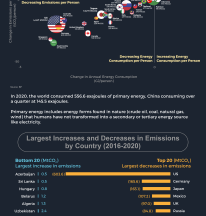
Charted: Country Emission Changes Since Paris
Aaron Foyer
November 5, 2021
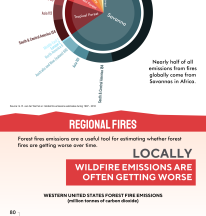
How Wildfires Have Changed Over the Last 20 Years
Aaron Foyer
September 22, 2021
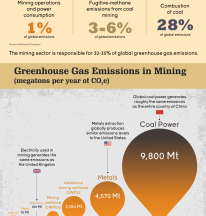
Visualized: Mining Emissions and How They Can be Addressed
Aaron Foyer
August 20, 2021
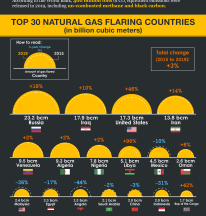
Ranking the Top 30 Global Natural Gas Flaring Countries
Aaron Foyer
April 30, 2021
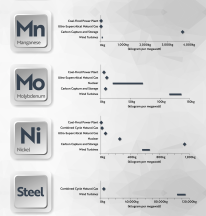
The Energy Transition: Mineral Demand for a Low-Carbon Future
Aaron Foyer
April 23, 2021
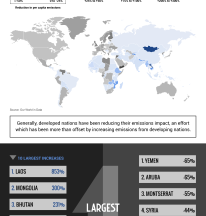
Every Country’s Increase or Reduction Emissions Over the Last 10 Years
Aaron Foyer
March 26, 2021
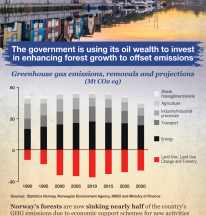
How Norway is Using its Oil Industry to Go Green
Aaron Foyer
March 19, 2021
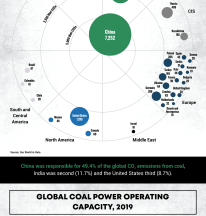
The Environmental Impact of the Coal Industry
Aaron Foyer
February 12, 2021
Posts navigation
Previous
1
2
3
Next
Search for: