×
Energy
Oil
Nuclear
Renewables
Bioenergy
Coal
Environment
Emissions
Sustainability
Carbon Markets
Technology
Energy Storage and Batteries
Carbon Capture
Transportation
Infrastructure
Materials
Space
Electricity
Hydrogen
Mining and Minerals
Energy
Oil
Natural Gas
Nuclear
Renewables
Bioenergy
Coal
Environment
Emissions
Sustainability
Carbon Markets
Technology
Energy Storage and Batteries
Carbon Capture
Transportation
Infrastructure
Materials
Space
Electricity
Hydrogen
Mining and Minerals
Search
Susbcribe
Susbcribe
Home »
Infographics - Page 5
Infographics
Energy
Bioenergy
Coal
Nuclear
Oil
Natural Gas
Renewables
Environment
Carbon Markets
Emissions
Sustainability
Technology
Carbon Capture
Electricity
Energy Storage and Batteries
Hydrogen
Infrastructure
Materials
Mining and Minerals
Space
Transportation
Category Menu
Energy
Bioenergy
Coal
Nuclear
Oil
Natural Gas
Renewables
Environment
Carbon Markets
Emissions
Sustainability
Technology
Carbon Capture
Electricity
Energy Storage and Batteries
Hydrogen
Infrastructure
Materials
Mining and Minerals
Space
Transportation
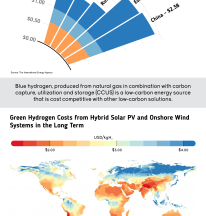
Charted: The Production Costs of Hydrogen Across the Globe
Aaron Foyer
September 3, 2021
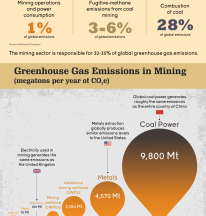
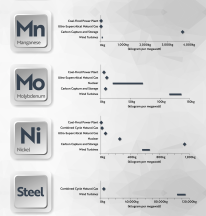
Visualized: Mining Emissions and How They Can be Addressed
Aaron Foyer
August 20, 2021
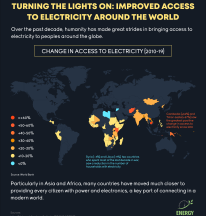
Turning the Lights On: Access to Electricity Over the Last Decade
Aaron Foyer
July 16, 2021
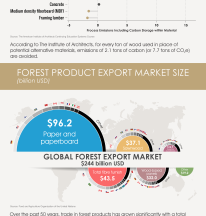
Forest Products: The Only Major Building Material that Sequesters Carbon
Aaron Foyer
July 9, 2021
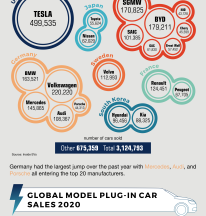
By the Numbers: The Top Electric Vehicle Manufacturers in 2020
Aaron Foyer
July 2, 2021
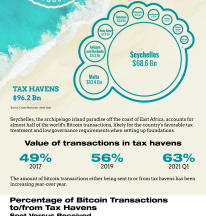
Visualizing the Offshore Tax Havens Used for Bitcoin Transactions
Aaron Foyer
June 4, 2021
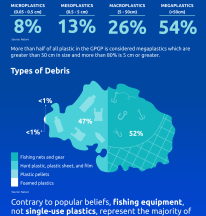
Mapping Out the Great Pacific Garbage Patch
Aaron Foyer
May 14, 2021
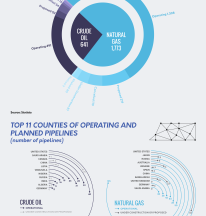
Visualizing Future Pipeline Projects Around the World
Aaron Foyer
May 7, 2021
The Energy Transition: Mineral Demand for a Low-Carbon Future
Aaron Foyer
April 23, 2021
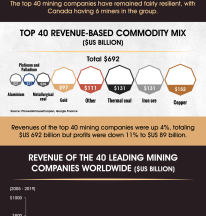
The Minerals Market: Global Metals and Their Producers
Aaron Foyer
April 16, 2021
Posts navigation
Previous
1
…
4
5
6
…
8
Next
Search for: