×
Energy
Oil
Nuclear
Renewables
Bioenergy
Coal
Environment
Emissions
Sustainability
Carbon Markets
Technology
Energy Storage and Batteries
Carbon Capture
Transportation
Infrastructure
Materials
Space
Electricity
Hydrogen
Mining and Minerals
Energy
Oil
Natural Gas
Nuclear
Renewables
Bioenergy
Coal
Environment
Emissions
Sustainability
Carbon Markets
Technology
Energy Storage and Batteries
Carbon Capture
Transportation
Infrastructure
Materials
Space
Electricity
Hydrogen
Mining and Minerals
Search
Susbcribe
Susbcribe
Home »
Infographics - Page 4
Infographics
Energy
Bioenergy
Coal
Nuclear
Oil
Natural Gas
Renewables
Environment
Carbon Markets
Emissions
Sustainability
Technology
Carbon Capture
Electricity
Energy Storage and Batteries
Hydrogen
Infrastructure
Materials
Mining and Minerals
Space
Transportation
Category Menu
Energy
Bioenergy
Coal
Nuclear
Oil
Natural Gas
Renewables
Environment
Carbon Markets
Emissions
Sustainability
Technology
Carbon Capture
Electricity
Energy Storage and Batteries
Hydrogen
Infrastructure
Materials
Mining and Minerals
Space
Transportation
The 10 Celebrities with the Largest Carbon Footprint from Flying
Aaron Foyer
August 12, 2022
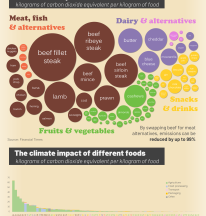
The Climate Impact of Food and Drinks
Aaron Foyer
August 5, 2022
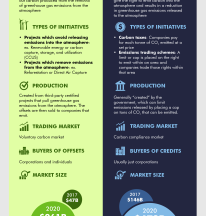
Explainer: The Difference Between Carbon Offsets and Carbon Credits
Aaron Foyer
July 29, 2022
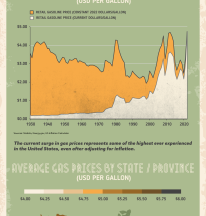
Charted and Mapped: Comparing Current Gasoline Prices to the Past
Aaron Foyer
July 22, 2022
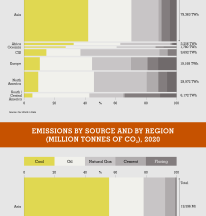
Visualizing Coal’s Dominant Role in Global Emissions
Aaron Foyer
July 15, 2022
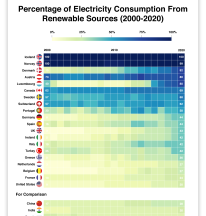
Visualized: Renewable Energy Growth in the OECD
Aaron Foyer
June 24, 2022
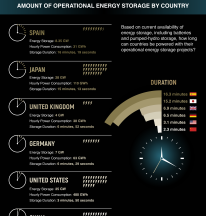
How Long Can Countries Run on Energy Storage?
Aaron Foyer
June 17, 2022
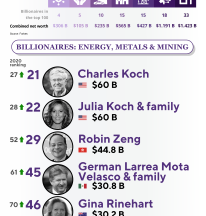
Forbes 2021: Top 100 Billionaires in Energy, Metals and Mining
Aaron Foyer
June 10, 2022
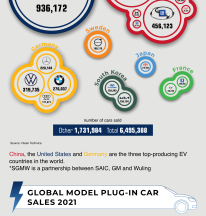
Electric Vehicles Manufacturing 2021
Aaron Foyer
June 3, 2022
Visualized: Oil Versus Democracy
Aaron Foyer
May 20, 2022
Posts navigation
Previous
1
…
3
4
5
…
12
Next
Search for: