×
Energy
Oil
Nuclear
Renewables
Bioenergy
Coal
Environment
Emissions
Sustainability
Carbon Markets
Technology
Energy Storage and Batteries
Carbon Capture
Transportation
Infrastructure
Materials
Space
Electricity
Hydrogen
Mining and Minerals
Energy
Oil
Natural Gas
Nuclear
Renewables
Bioenergy
Coal
Environment
Emissions
Sustainability
Carbon Markets
Technology
Energy Storage and Batteries
Carbon Capture
Transportation
Infrastructure
Materials
Space
Electricity
Hydrogen
Mining and Minerals
Search
Susbcribe
Susbcribe
Home »
Infographics - Page 5
Infographics
Energy
Bioenergy
Coal
Nuclear
Oil
Natural Gas
Renewables
Environment
Carbon Markets
Emissions
Sustainability
Technology
Carbon Capture
Electricity
Energy Storage and Batteries
Hydrogen
Infrastructure
Materials
Mining and Minerals
Space
Transportation
Category Menu
Energy
Bioenergy
Coal
Nuclear
Oil
Natural Gas
Renewables
Environment
Carbon Markets
Emissions
Sustainability
Technology
Carbon Capture
Electricity
Energy Storage and Batteries
Hydrogen
Infrastructure
Materials
Mining and Minerals
Space
Transportation
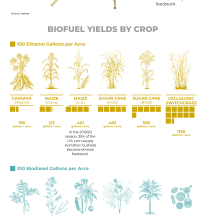
The Best Crops for Biofuels, Visualized
Aaron Foyer
May 13, 2022
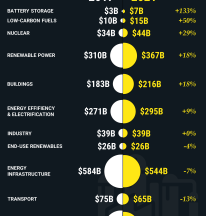
4-Year Change in Capital Spending: Global Energy Investments
Aaron Foyer
May 6, 2022
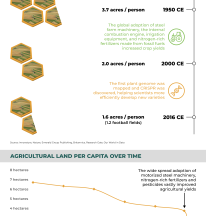
Agriculture: How Much Land is Needed to Feed One Person?
Aaron Foyer
April 29, 2022
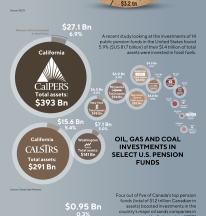
Energy and Retirement: Pension Fund Investments in Oil and Gas
Aaron Foyer
April 22, 2022
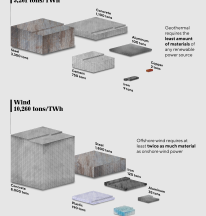
Visualized: Materials Needed to Power the World
Aaron Foyer
April 8, 2022
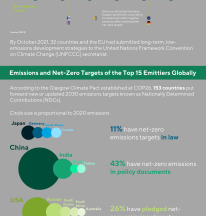
Net Zero: The Current State of Emissions Targets in 2022
Aaron Foyer
April 1, 2022
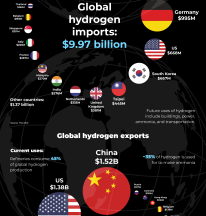
Visualized: Global Hydrogen Imports and Exports
Aaron Foyer
March 25, 2022
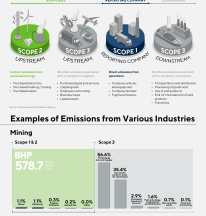
An Explainer: What are Scope 1, 2 and 3 Emissions?
Aaron Foyer
March 18, 2022
Charted: Women in the Energy Sector and What Is Changing
Aaron Foyer
March 11, 2022
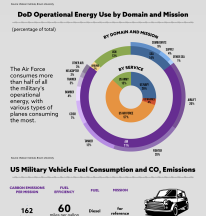
Visualized: The Energy of the United States Military
Cody Good
March 4, 2022
Posts navigation
Previous
1
…
4
5
6
…
12
Next
Search for: