×
Energy
Oil
Nuclear
Renewables
Bioenergy
Coal
Environment
Emissions
Sustainability
Carbon Markets
Technology
Energy Storage and Batteries
Carbon Capture
Transportation
Infrastructure
Materials
Space
Electricity
Hydrogen
Mining and Minerals
Energy
Oil
Natural Gas
Nuclear
Renewables
Bioenergy
Coal
Environment
Emissions
Sustainability
Carbon Markets
Technology
Energy Storage and Batteries
Carbon Capture
Transportation
Infrastructure
Materials
Space
Electricity
Hydrogen
Mining and Minerals
Search
Susbcribe
Susbcribe
Home »
Infographics - Page 8
Infographics
Energy
Bioenergy
Coal
Nuclear
Oil
Natural Gas
Renewables
Environment
Carbon Markets
Emissions
Sustainability
Technology
Carbon Capture
Electricity
Energy Storage and Batteries
Hydrogen
Infrastructure
Materials
Mining and Minerals
Space
Transportation
Category Menu
Energy
Bioenergy
Coal
Nuclear
Oil
Natural Gas
Renewables
Environment
Carbon Markets
Emissions
Sustainability
Technology
Carbon Capture
Electricity
Energy Storage and Batteries
Hydrogen
Infrastructure
Materials
Mining and Minerals
Space
Transportation
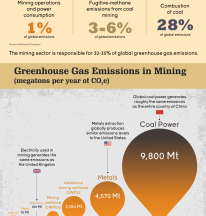
Visualized: Mining Emissions and How They Can be Addressed
Aaron Foyer
August 20, 2021
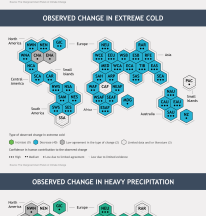
Four Maps Which Show How Humans Have Already Affected Climate
Aaron Foyer
August 13, 2021
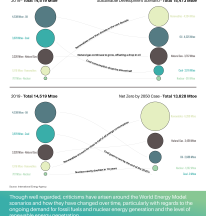
The Different Potential Energy Scenarios of the Next Decade
Aaron Foyer
August 6, 2021
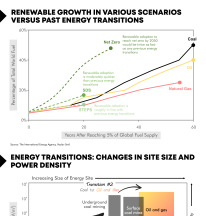
Energy Transitions: Benchmarking the IEA Net Zero by 2050 Scenario
Aaron Foyer
July 30, 2021
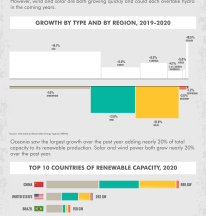
Renewable Energy: Global Capacity by Region and Type
Aaron Foyer
July 23, 2021
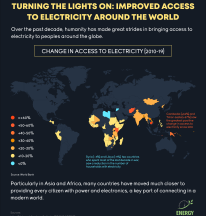
Turning the Lights On: Access to Electricity Over the Last Decade
Aaron Foyer
July 16, 2021
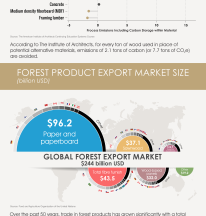
Forest Products: The Only Major Building Material that Sequesters Carbon
Aaron Foyer
July 9, 2021
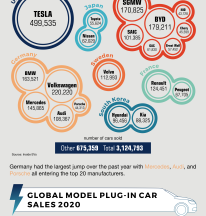
By the Numbers: The Top Electric Vehicle Manufacturers in 2020
Aaron Foyer
July 2, 2021
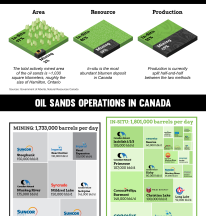
Visualizing the Size and Scale of the Canadian Oil Sands
Aaron Foyer
June 18, 2021
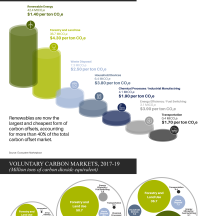
Explainer: The Global Market for Carbon Offsets
Aaron Foyer
June 11, 2021
Posts navigation
Previous
1
…
7
8
9
…
12
Next
Search for: